U.S. Geological Survey
Gallery
Images of PRISM Data
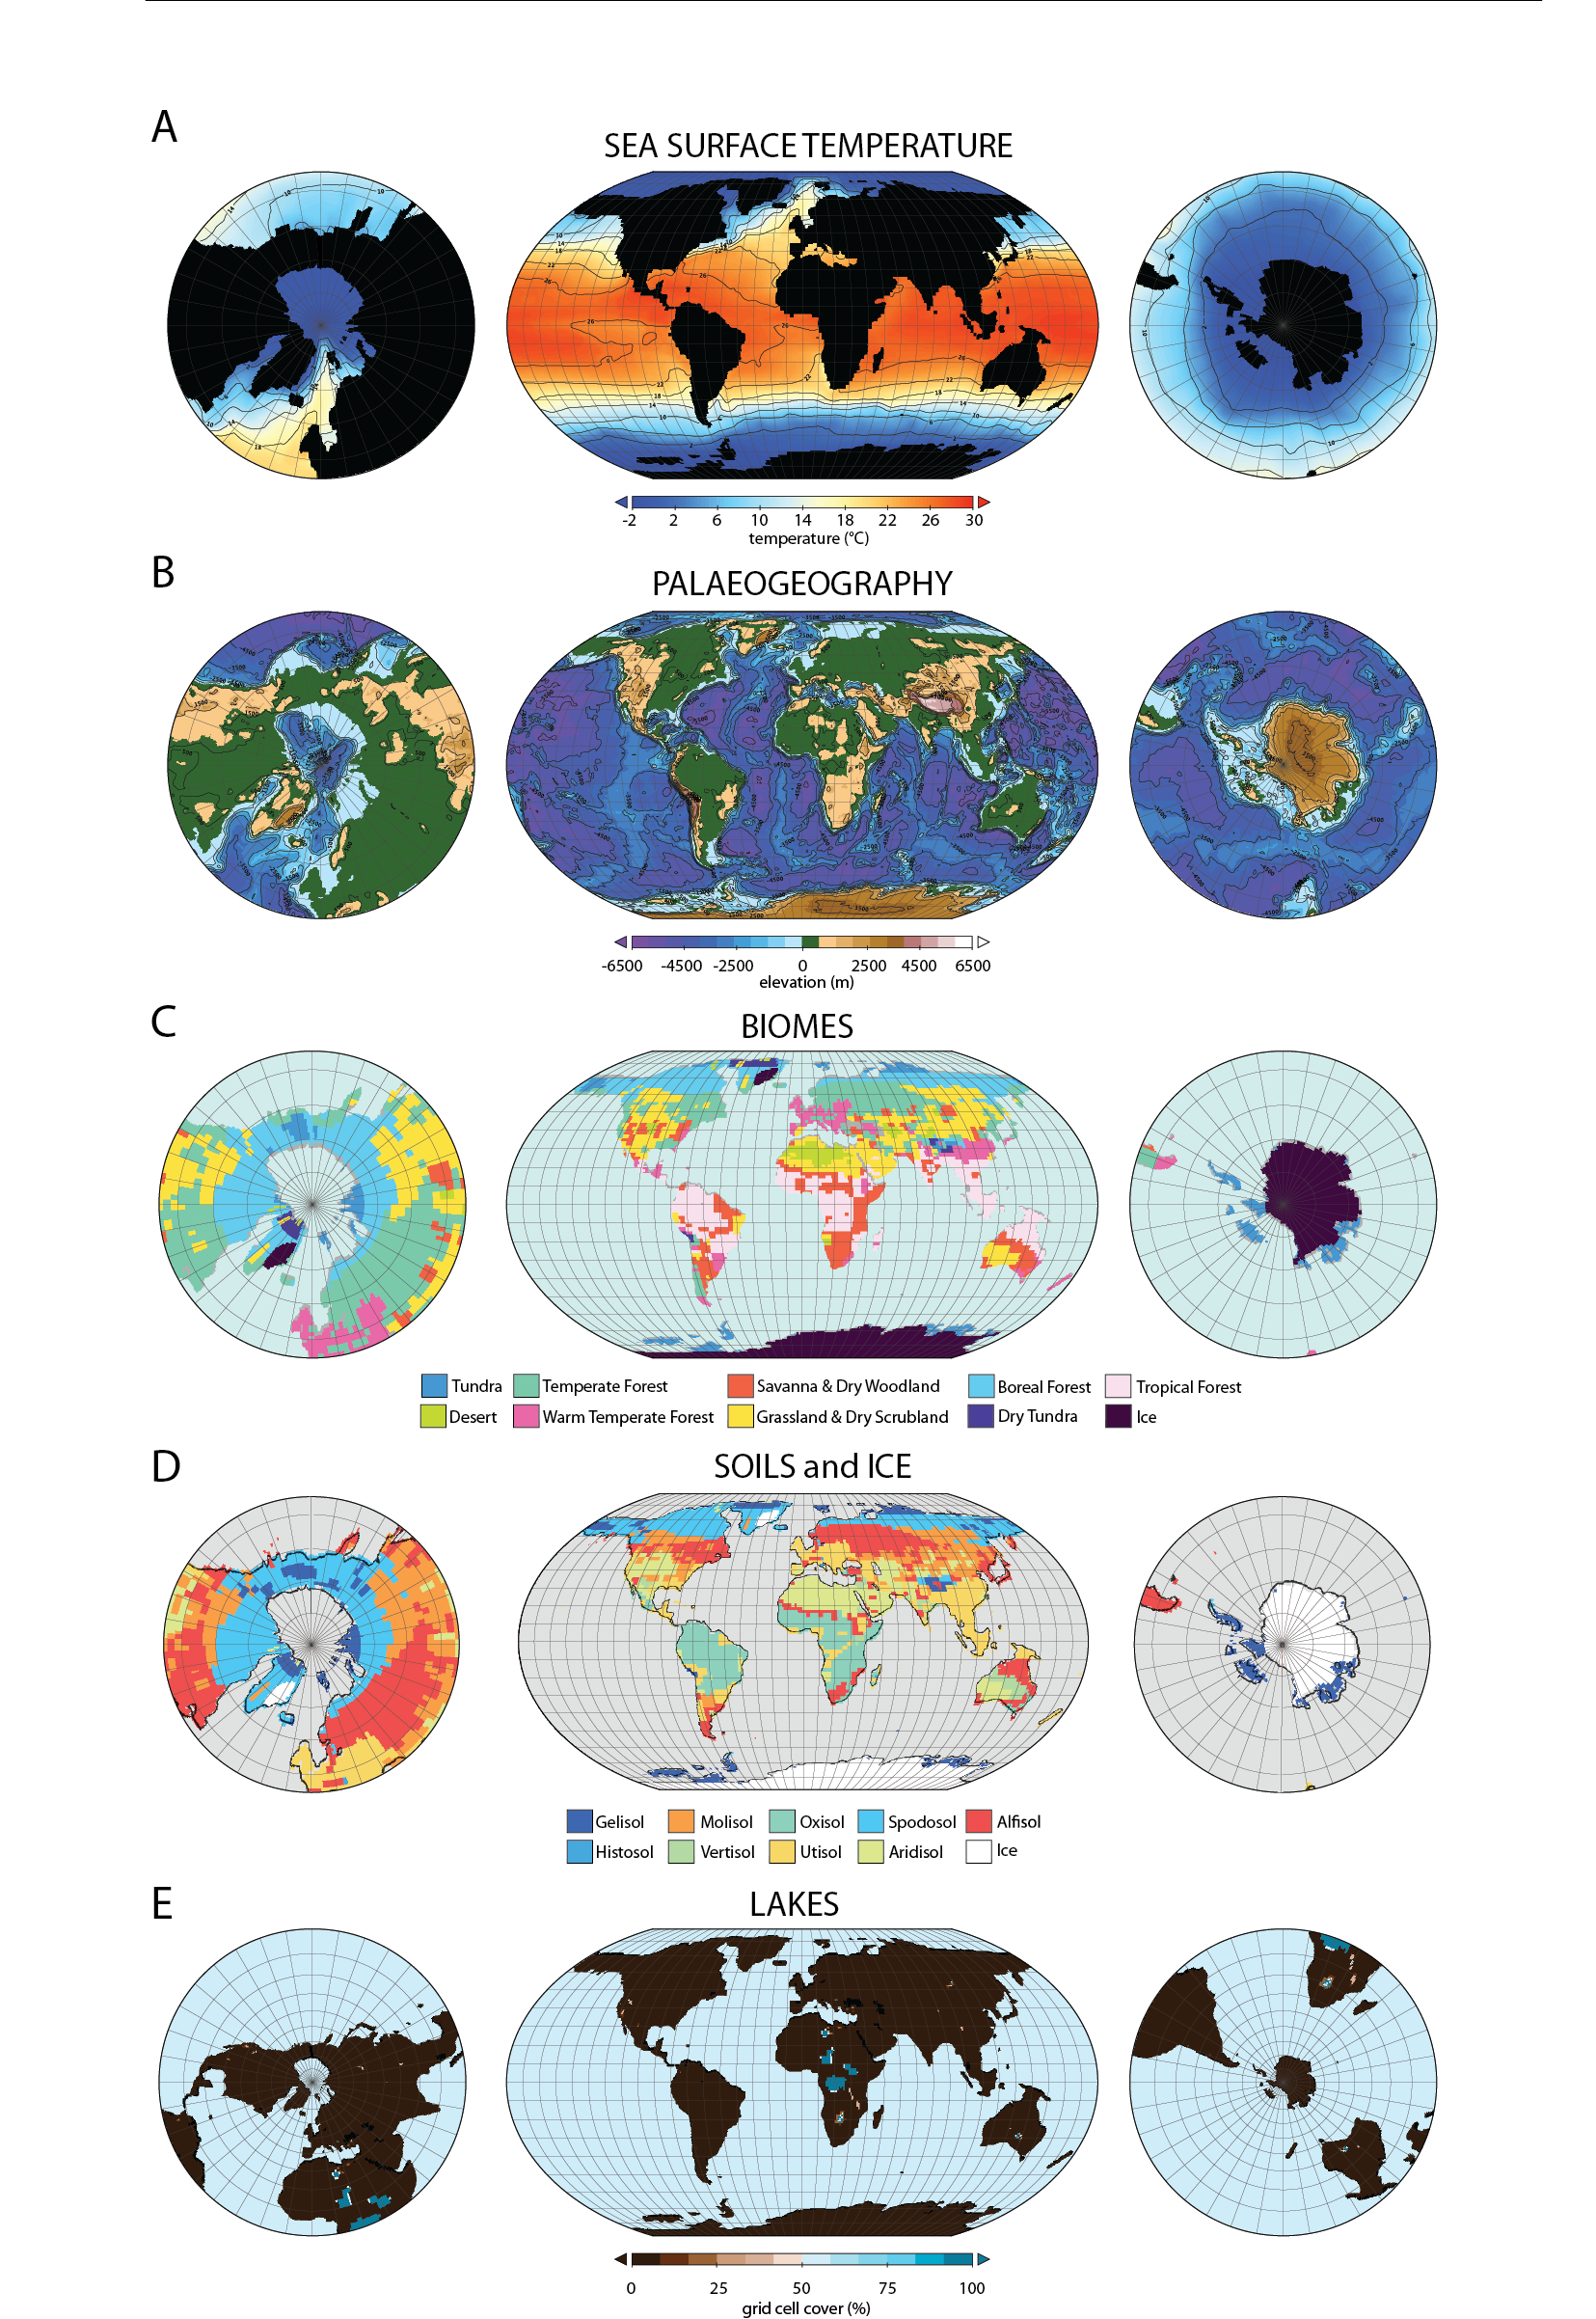
Figure 1. PRISM4 reconstruction. (A) mean annual sea-surface temperature, (B) palaeogeography, (C) biomes, (D) soils and land ice, (E) large lakes. 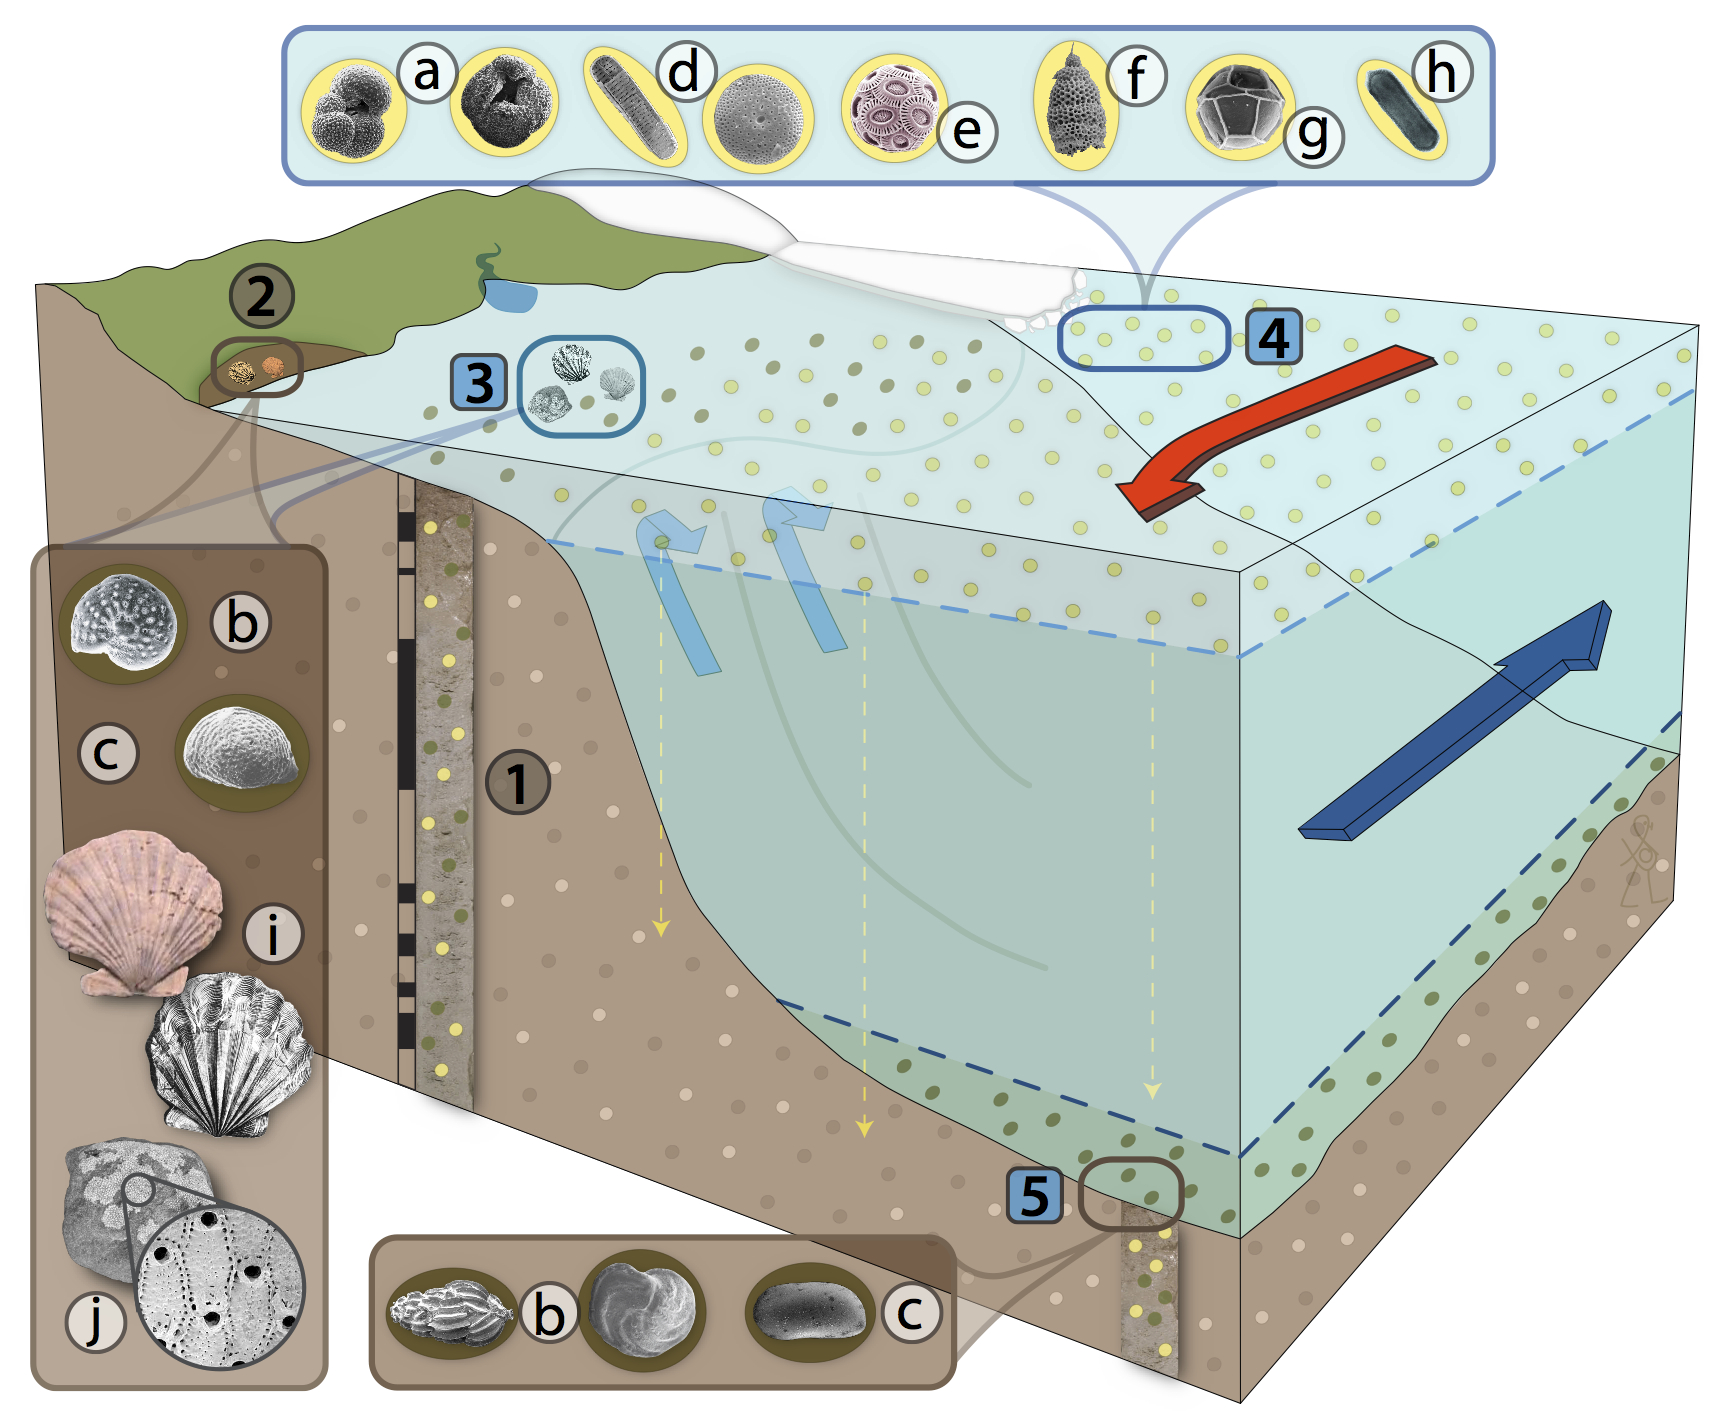
Figure 2. Mid-Piacenzian generalized marine environment. PRISM archives include (1) deep-sea cores and (2) outcrops on land. Palaeoenvironments sampled range from (3) shelf to (4) open-ocean and (5) deep-ocean bottom. Signal carriers include (a) planktonic and (b) benthic foraminifers, (c) ostracods, (d) diatoms, (e) calcareous nannoplankton, (f) radiolaria, (g) dinoflagellates, (h) picoplankton, (i) mollusks and (j) bryozoa. Fish teeth (also used as signal carriers) are not figured. Quantitative analysis of planktonic and benthic foraminifer, diatom, radiolaria and dinoflagellate assemblages provide SST, shallow bottom water temperature (SBT), productivity, salinity and sea ice distribution. Calibrated biomarker molecules derived from nanno- and picoplankton provide additional SST information. Macro invertebrate assemblages provide semi quantitative estimates of SBT and mean annual range in temperature (MART). Oxygen isotopic analysis of mollusks allows for seasonality estimates. Mg/Ca analysis of planktonic and benthic foraminifers establishes independent SST, SBT and deep ocean temperature (DOT). Paired Mg/Ca and oxygen isotopic analyses on deep ocean benthic foraminifers and ostracods allow for sea level and global ice volume estimates. Analysis of stable carbon isotopes on benthic foraminifers and Nd derived from fish teeth provide estimates of paleocirculation. An increased understanding of the timing and variability of production of these signal carriers and knowledge of their environmental preferences (e.g. depth habitat) provide a means of analyzing upwelling systems and constraining circulation (shown by arrows). 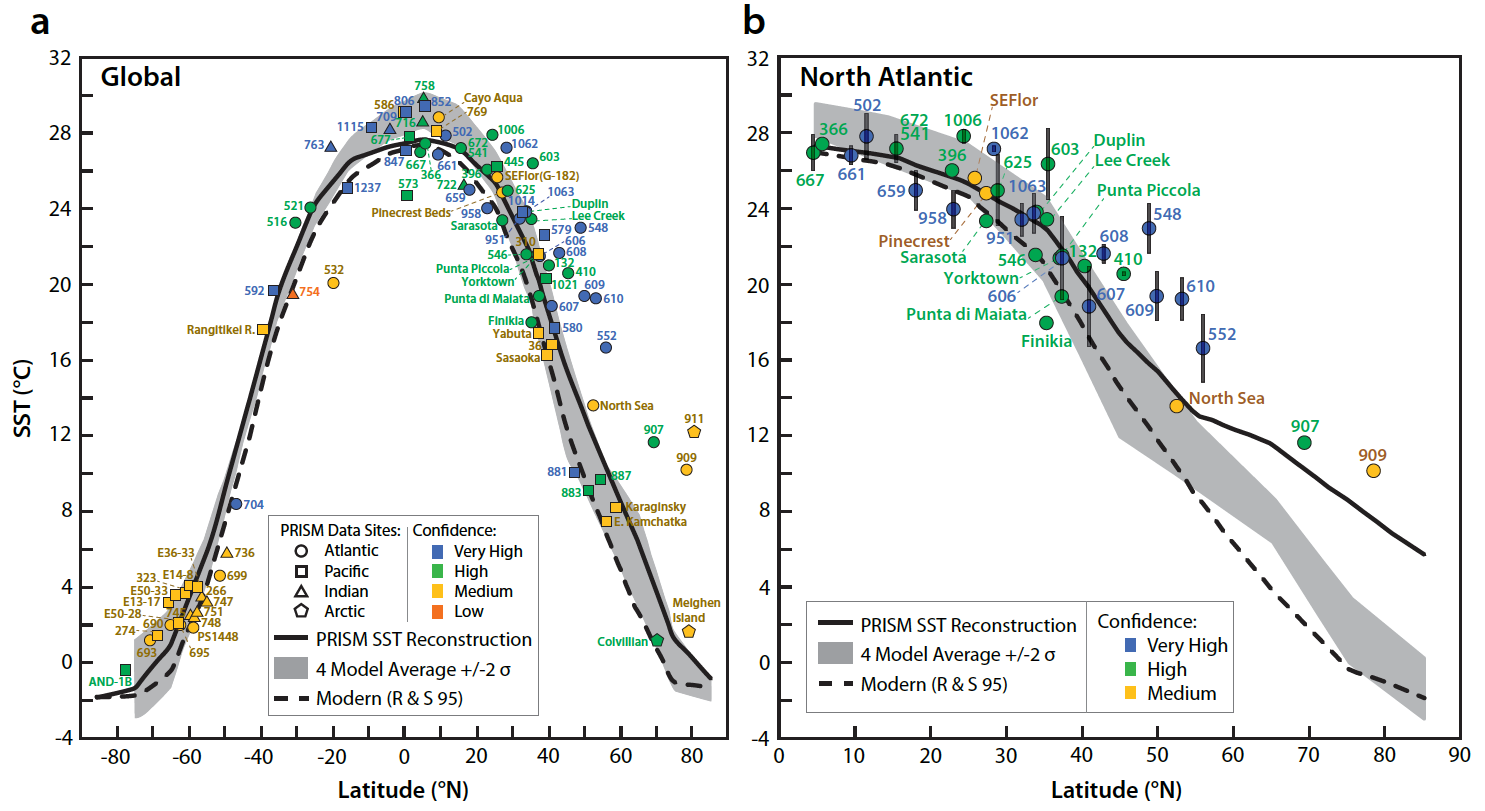
Figure 3. Data and model mean annual temperature profiles. a, Verification dataset SST estimates superimposed on zonally averaged multimodel mean annual SST from four climate-model simulations shown as grey band with width equal to ±2σ. Symbols indicate ocean basin; colours indicate level of confidence. Zonally averaged modern mean annual SST shown as dashed line, PRISM3 reconstruction shown as solid line. b, same as in a except North Atlantic region only, with ±2σ SST variability bars on deep-sea sites with better than 22 kyr sample resolution and multiple warm peaks in the SST-estimate time series. 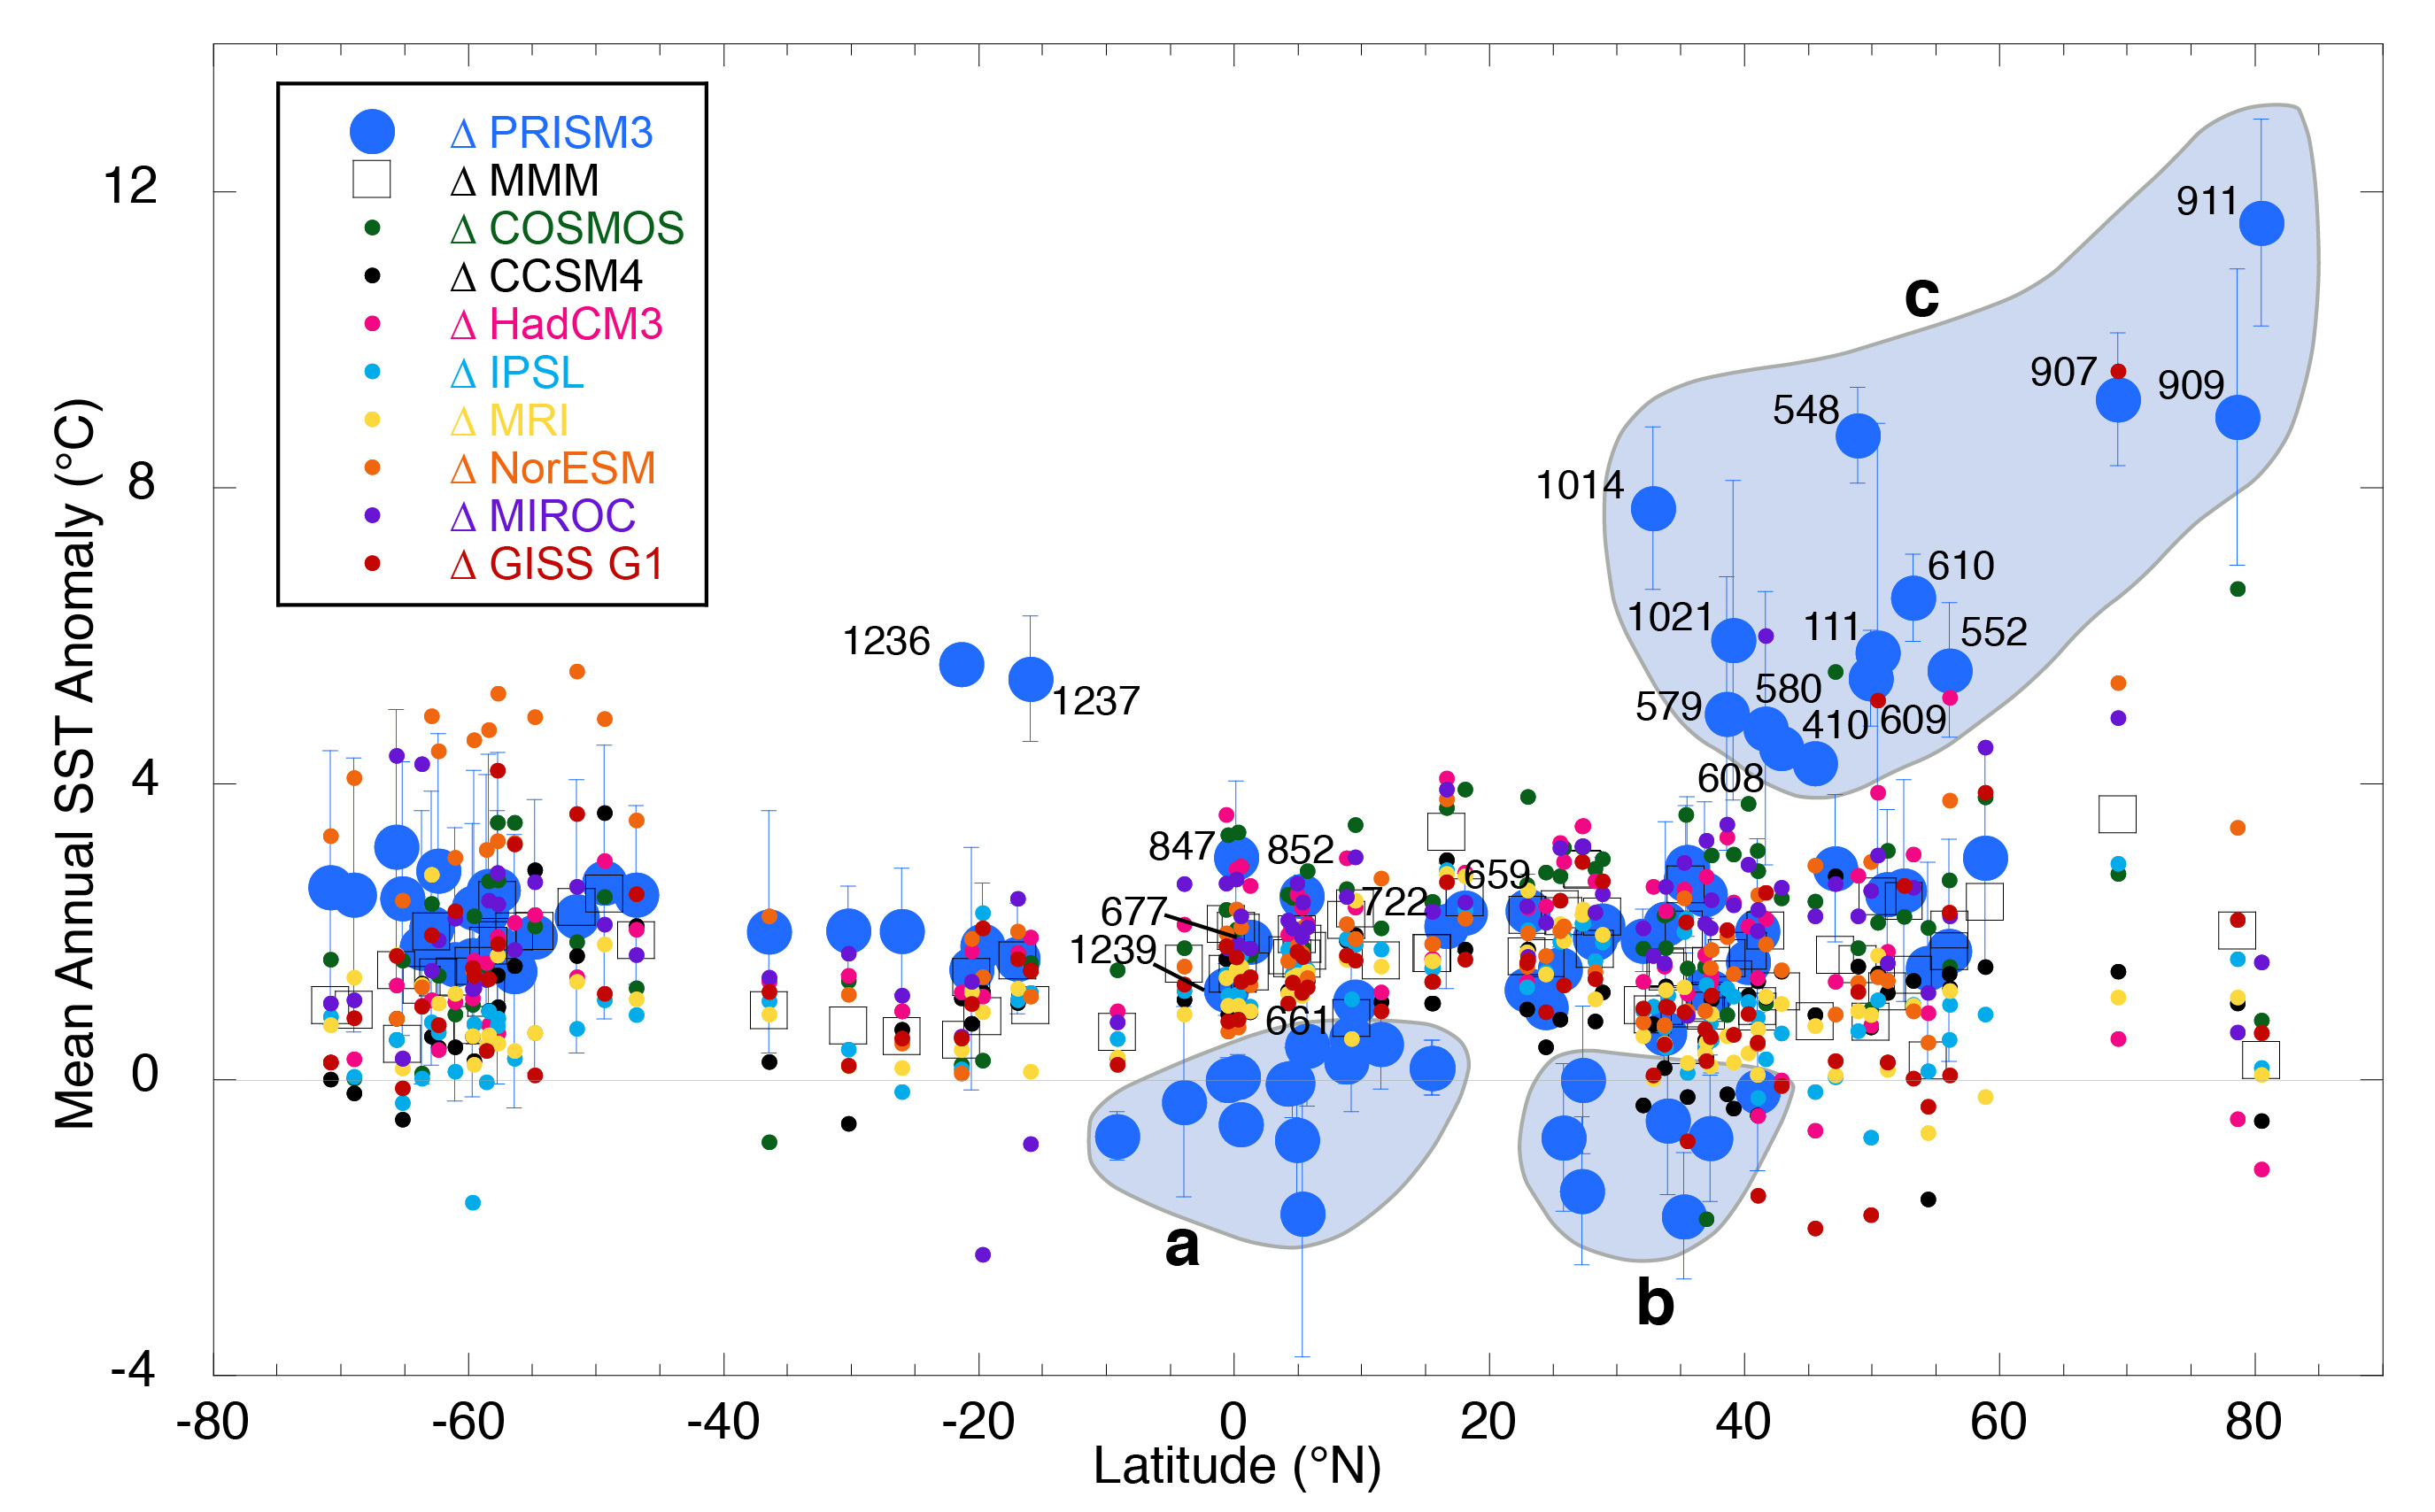
Figure 4. Scatter plot of multi-model-mean anomalies (squares) and PRISM3 data anomalies (large blue circles) by latitude. Vertical bars on data anomalies represent the variability of warm climate phase within the time-slab at each locality. Small colored circles represent individual model anomalies and show the spread of model estimates about the multi-model-mean. While not directly comparable in terms of the development of the means nor the meaning of variability, this plot provides a first order comparison of the anomalies. Encircled areas are (a) PRISM low latitude sites outside of upwelling areas; (b) North Atlantic coastal sequences and Mediterranean sites; (c) large anomaly PRISM sites from the northern hemisphere. Numbers identify Ocean Drilling Program sites.
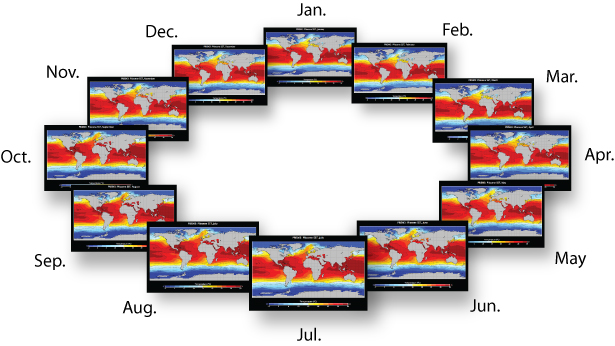
Pliocene sea surface temperature maps derived from the PRISM3_SST_v1.0 dataset.
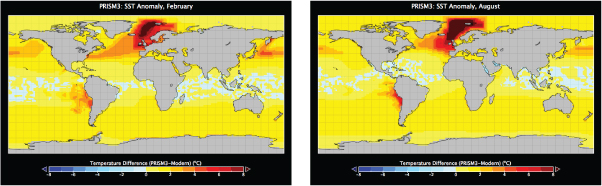
Pliocene vs. modern sea surface temperature anomaly.
|