Arctic Paleoceanography
| Arctic Ocean Temperature and Circulation Holocene Ocean Temperature off Northern Alaska |
Arctic Ocean Temperature and Circulation
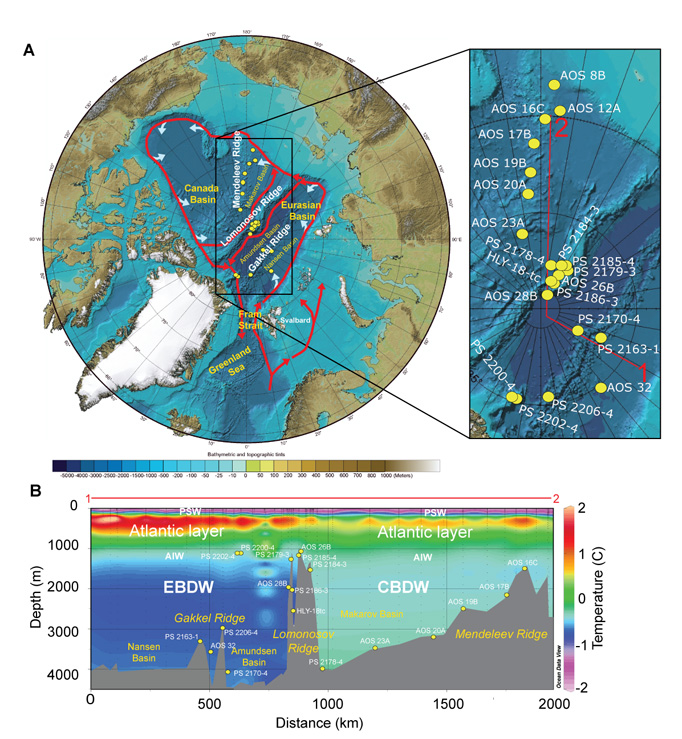
Arctic bottom water temperatures and ocean circulation were also reconstructed for the past 50,000 years using Mg/Ca ratios and faunal analyses. Fig 2A shows the location of sediment cores used in the paleoceanographic reconstruction of the last 50,000 years using ostracode faunal assemblages. 2A also shows the generalized circulation of the Atlantic Layer in red. The blue arrows depict brine formation on the continental shelves. Figure 2B depicts the Arctic-Nordic Sea temperature section 1 to 2 in Figure 2A from Ocean Data View. Bathymetry approximate. Figure 2. |

![]() U.S. Department of the Interior |
U.S. Geological Survey
U.S. Department of the Interior |
U.S. Geological Survey
URL: http://geology.er.usgs.gov/egpsc/arcticpaleoceanography/temperaturecirculation.html
Page Contact Information: Web Administrator
Page Last Modified: Thursday, 15-Dec-2016 12:41:11 EST