Arctic Paleoceanography
| Arctic Ocean Temperature and Circulation Holocene Ocean Temperature off Northern Alaska |
Holocene Ocean Temperature off Northern Alaska
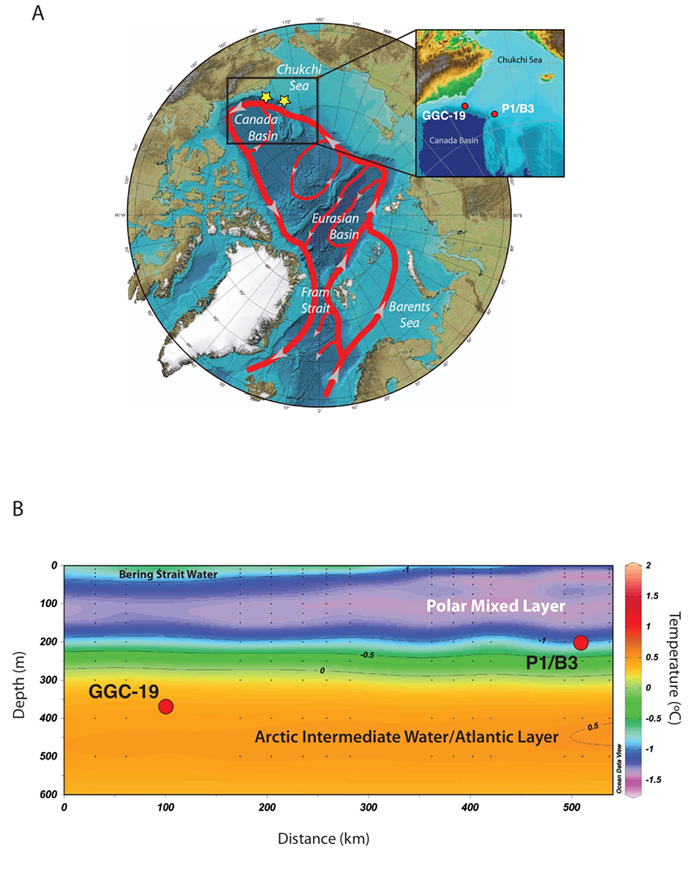
Holocene ocean temperatures were studied in the Beaufort-Chukchi Sea region off northern Alaska and compared to recent ocean warming in that region. Figure 3A shows the generalized circulation of the Atlantic Layer in the Arctic Ocean (from Rudels et al., 2004; and de Vernal et al., 2005). Warm, saline North Atlantic water (red line) enters the Arctic at shallow to intermediate depths through the Fram Strait and Barents Sea before circulating counterclockwise along the shelf margins and through the deep Arctic Basins. Yellow stars designate the two core sites that were used to reconstruct Holocene temperatures. Inset shows bathymetry near core sites GGC19 and P1/B3 (red circles). Figure 3B depicts the east-west mean annual temperature profile in the Beaufort-Chukchi shelf/slope region with core sites studied for Holocene paleoceanography marked by red circles. Temperature data are from Polar Science Center Hydrographic Climatology (PHC) plotted in Ocean Data View. Temperature is contoured at 0.5°C intervals (black lines). Individual temperature measurements (black points) were interpolated to the shown gridded field using DIVA gridding with a 50 km x 40 m window. Figure 3. |

![]() U.S. Department of the Interior |
U.S. Geological Survey
U.S. Department of the Interior |
U.S. Geological Survey
URL: http://geology.er.usgs.gov/egpsc/arcticpaleoceanography/holocenetemperature.html
Page Contact Information: Web Administrator
Page Last Modified: Thursday, 15-Dec-2016 12:09:42 EST